This feature is available for versions 2.15 and above |
Jump to:
Diagnostic Results Window – version 2.15 – 2.17
Diagnostic Results Window – versions 2.18+
Identifying high-impact 3D objects in the items list
What is it?
The status monitor is a feature that informs users and Editors about the quality of their connection, as well as the performance of the 3D environment on their device.
It’s ideal to reduce the amount of content so that the status monitor is green or yellow on all devices you’re targeting. This will allow the highest number of users to enjoy the experience without issues |
If there is a degradation of either connection or performance, the status monitor icon will appear in the top toolbar. When it does, it will usually be yellow, and rarely red.

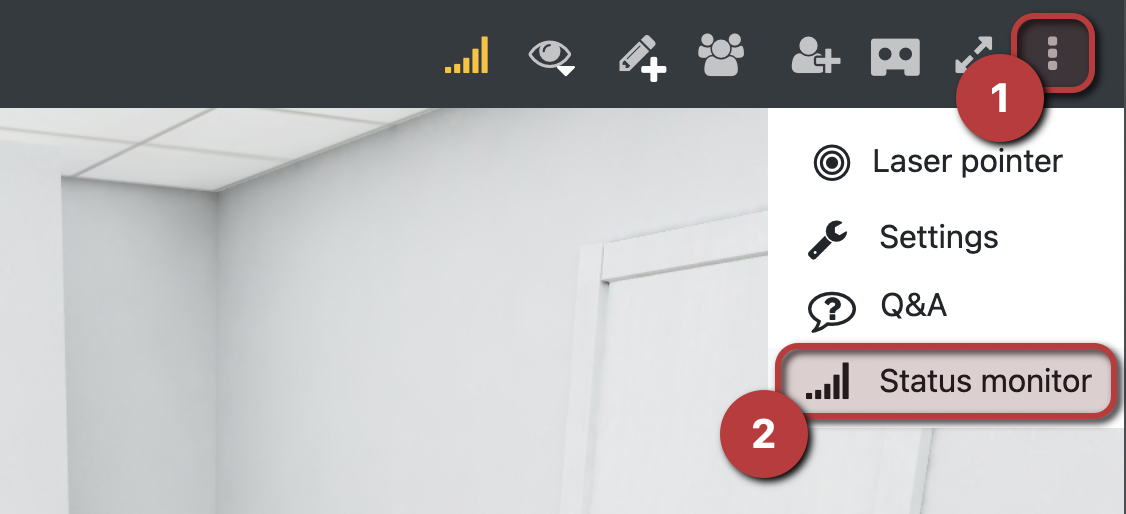
The feature can additionally be accessed at all times through the “three dots” menu on the right side of the top toolbar.
“Summary” view
When the status monitor is opened, it shows a “summary” view, useful to see the state of the 3D experience at a glance.
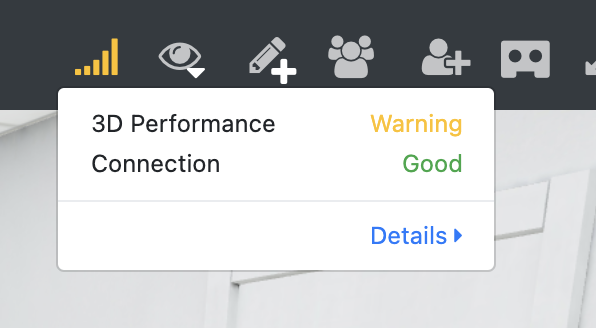
This popup contains two items:
- 3D performance summarizes how smoothly the 3D is running/is expected to run based on the characteristics of the device being used and the complexity of the environment.
- Connection shows the quality of the user’s internet connection, as well as to the platform’s servers.
Clicking or tapping on the Details▸ link will show the Detail view
“Detail” view
The detail view allows going more in-depth into what exactly is an obstacle for optimal performance.
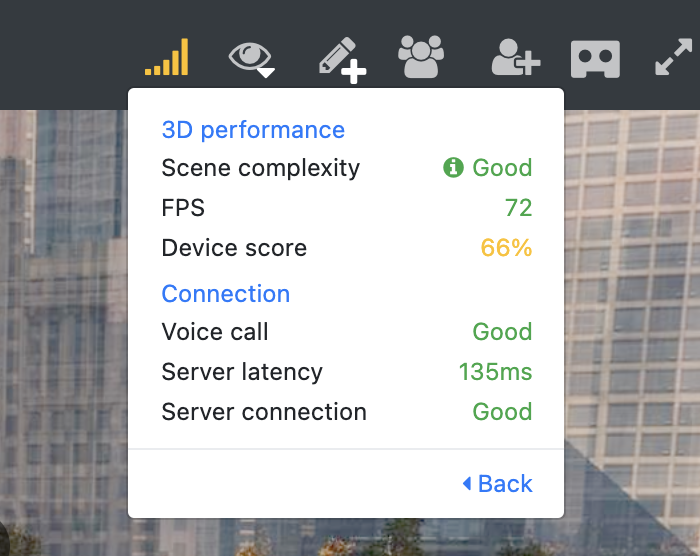
This view is split in the same two categories as the summary view, but each category now has more data available.
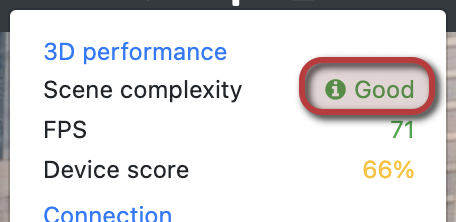
In the “3D performance” category, the following information is found:
- Scene complexity: a metric representing how “heavy” the 3D environment is, based on the number of triangles in 3D objects as well as the total drawcalls and materials.
Clicking on this value will launch the diagnostic tool. - FPS: this acronym stands for Frames Per Second, i.e. the amount of frames rendered every second. Higher values are better.
- Device score: a score between 0% and 100% (higher values are better) describing how well your device supports 3D environments. This is based on computing a number of factors such as what OS is running, the amount of available texture memory, etc.
In the “Connection” section, users can see:
- Voice call: this will only appear while the user has joined a conference call using built-in conferencing, and describes the quality of their connection to the conferencing service.
- Server latency: this metric represents the latency between the user and the multiuser server, i.e. how many milliseconds it takes for a message from the user to be sent to the server, and vice-versa. Lower values are better.
- Server connection: this value shows the quality of your connection to the multiuser server, i.e. whether you are connected or not, but also whether the connection is stable or unstable.
Content Performance Analyzer & Optimizer
When the status monitor warns about a 3D environment being too complex, the fault usually lies in a small number of unoptimized 3D meshes & models or textures. The diagnostic tool was created so Editors can quickly identify which meshes, models or textures are having a negative impact on performance, and decide how to deal with them (i.e. whether to remove them outright or optimize them).
In order to launch the diagnostic tool, open the status monitor, enter the detail view, and click on the value for “Scene complexity”
A warning will pop up – click Run diagnostic tool
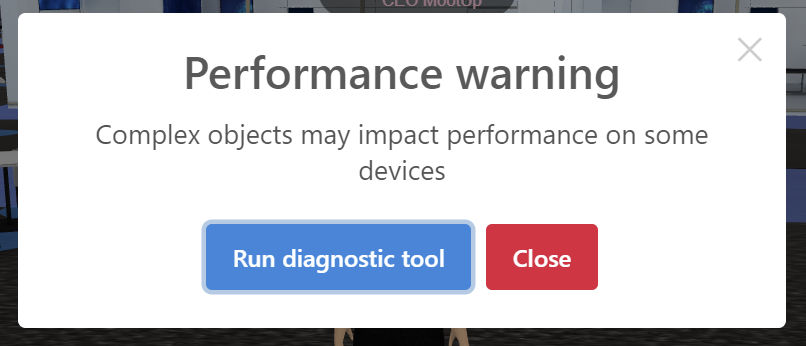
For Editors only, a warning notification will appear when loading the 3D environment if the scene needs optimizing. The diagnostic tool can be launched directly from this notification by clicking on “optimizing the space”. |

Once the diagnostic tool is launched, it will run a series of diagnostics to accurately assess the complexity of the scene – as it is doing so, you will see a popup that says “Running diagnostics…”

Diagnostic Results Window – version 2.15 – 2.17
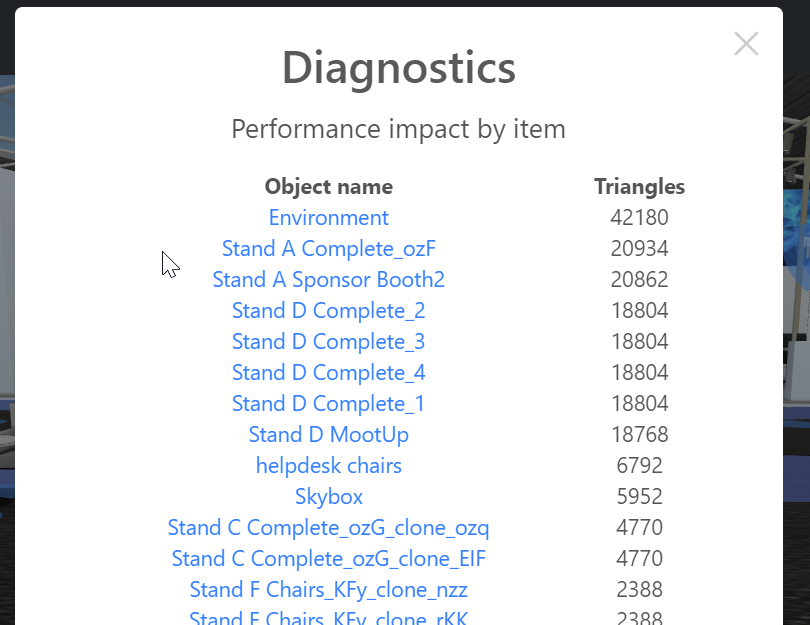
When the diagnostics runs have been completed, the list of items and their impact on performance is shown. Since the diagnostic tool takes into account two different metrics (triangles and drawcalls) that are independent but can both affect performance, the window with the diagnostics results is separated in two sections.
The first section shows the number of triangles for each object, ordered from high to low (higher values mean a larger impact on performance):
…and the second (found by scrolling down, if the list of items is very long) shows the amount of drawcalls for each objects, also ordered from high to low (higher values mean a larger impact on performance):
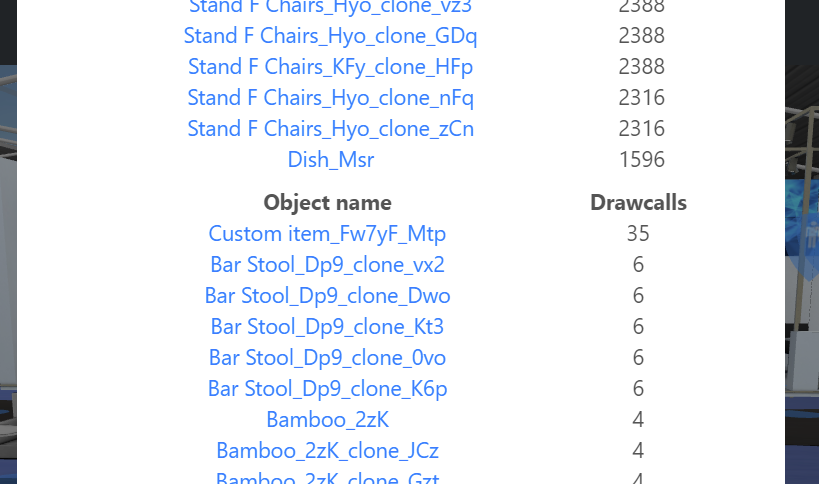
A few items will usually show disproportionately higher values than the rest, and you can open the details of any item in the list by clicking on their name, which will allow you to find the exact model being used, as well as simply delete the object.
Diagnostic Results Window – versions 2.18+
When the diagnostics runs have been completed, the list of items and their impact on performance is shown. Since the diagnostic tool takes into account three different metrics (polygons, drawcalls and textures) that are independent but can all affect performance, the window with the diagnostics results is separated in three sections.
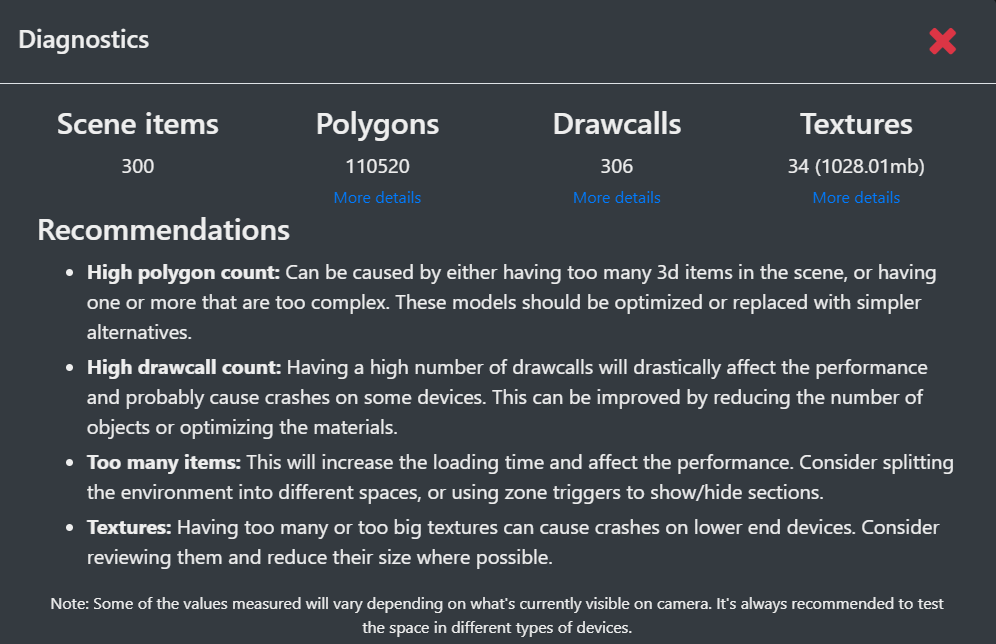
“Polygons” shows the number of triangles for each object, ordered from high to low (higher values mean a larger impact on performance). “Drawcalls” shows the amount of drawcalls for each object, also ordered from high to low (higher values mean a larger impact on performance). “Textures” show the size of the textures used by objects in the 3D environment, ordered from largest to smallest. Click “More details” under any section to open that section’s list.
Mesh Complexity – Polygons & Triangles Results Window
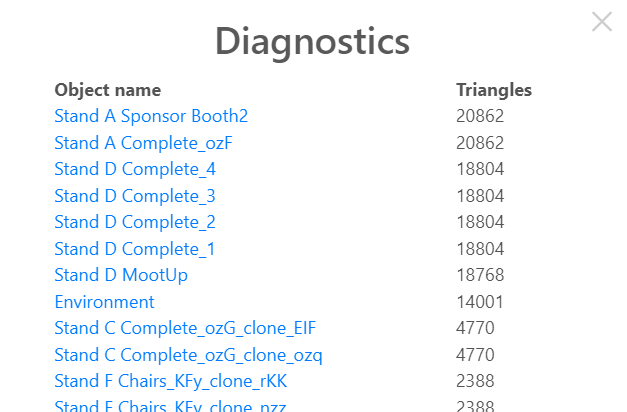
A few items will usually show disproportionately higher values than the rest, and you can open the details of any item in the list by clicking on their name, which will allow you to find the exact model being used, as well as simply delete the object.
Scene Complexity – Drawcalls Results Window
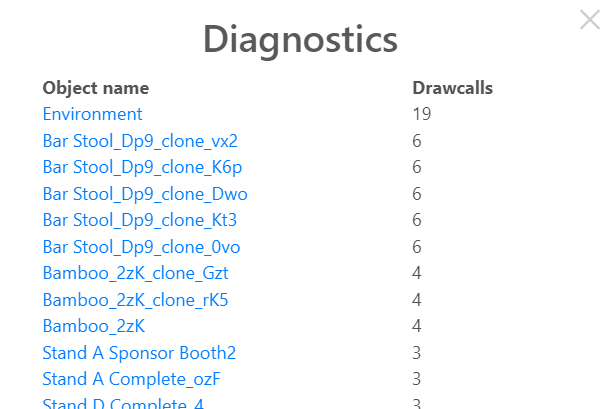
A few items will usually show disproportionately higher values than the rest, and you can open the details of any item in the list by clicking on their name, which will allow you to find the exact model being used, as well as simply delete the object.
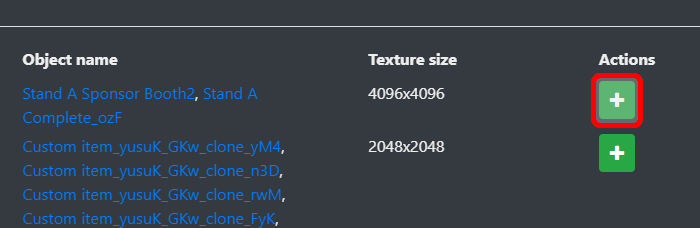
Textures Results Window
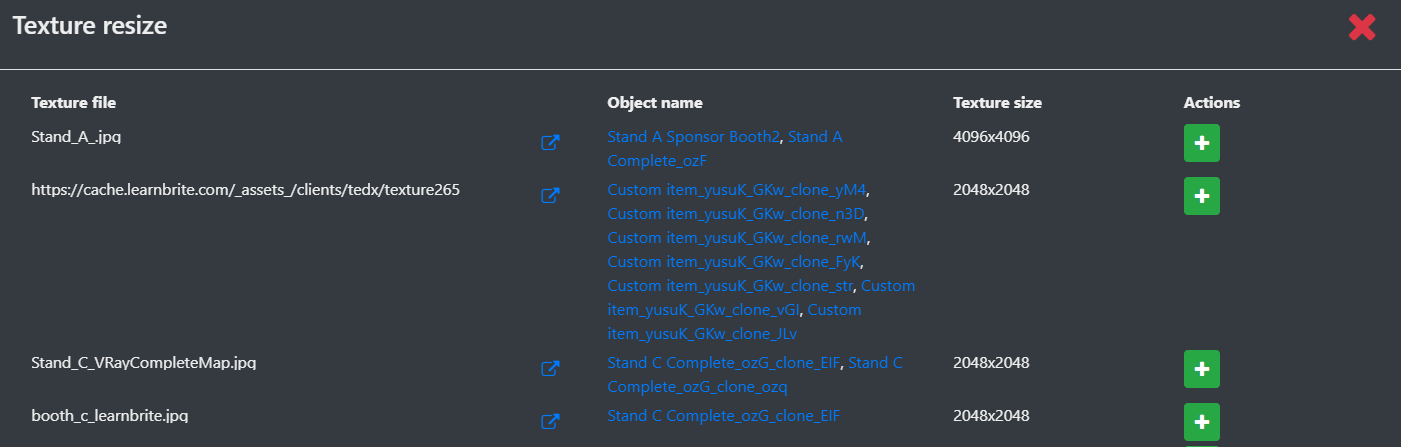
The texture results window allows you to resize very large textures used by the 3D objects, improving performance upon reloading the space.
Click the “+” button in the Actions column to open the resize field.
Enter the new texture maximum size, 512 is recommended for improved performance.
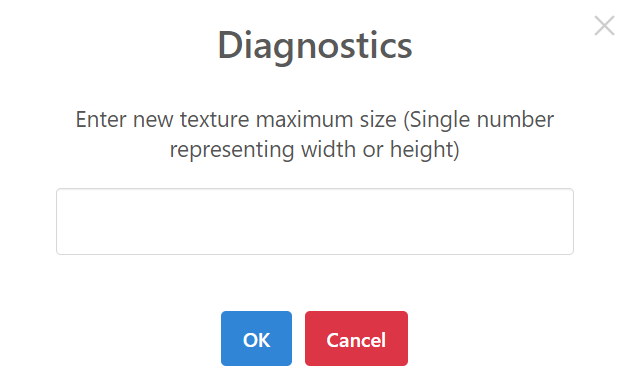
Click the OK button.

The new texture size is reflected in the window.
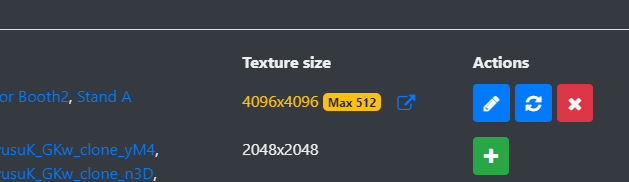
The pencil icon is used to edit the field. The circular arrows icon will reload the object with the new texture size. The red x icon will delete the changes.
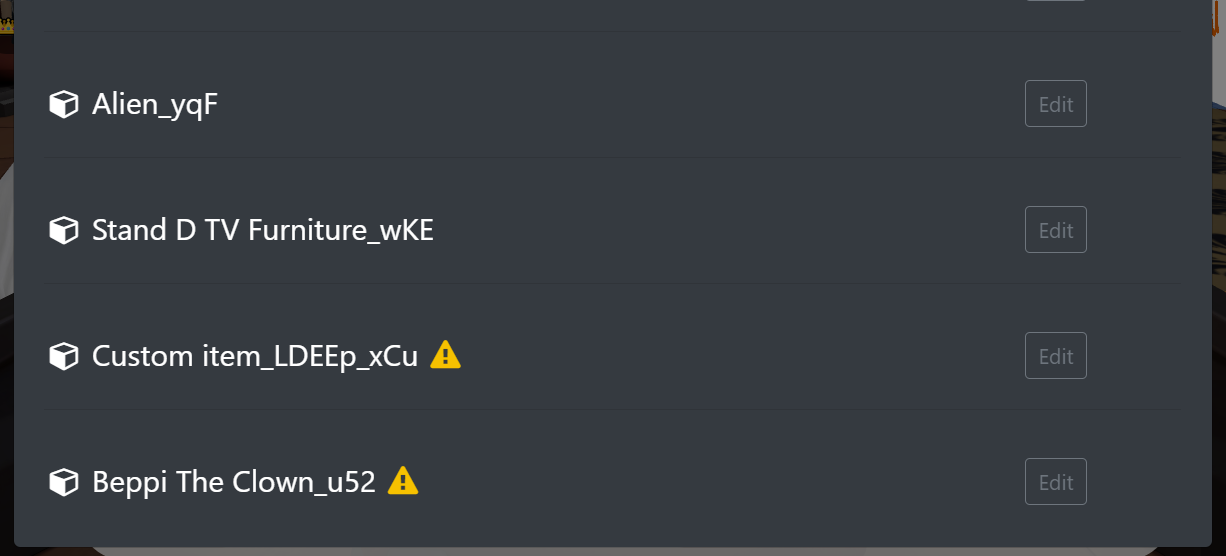
Identifying high-impact 3D objects in the items list
An alternative method to show which 3D objects might be causing performance issues is to open the list of 3D objects by clicking on “Show items list” within the edit menu.
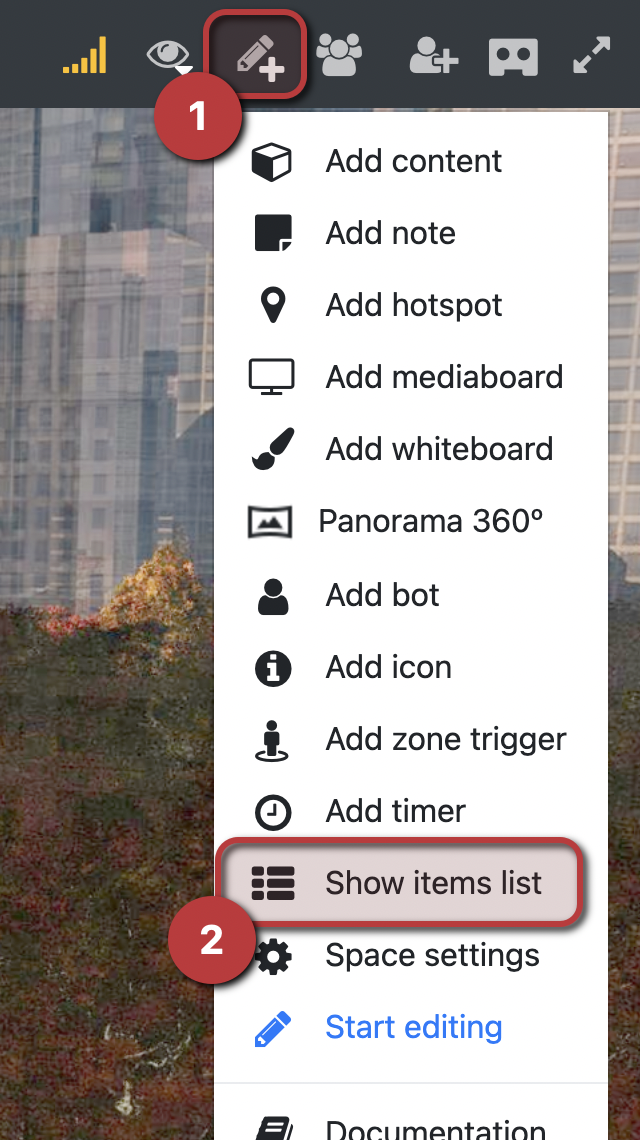
All items with a high amount of triangles or drawcalls will have a yellow warning sign on the right of their name; clicking on the warning sign will open the diagnostic tool.